Alerts
Overview
Alerts automatically send a notification when a metric — GPU utilization, memory, disk, etc. — crosses a threshold you've set. They are used to detect training completion, catch problems early, and prevent idle-resource cost leaks.
An alert is made up of three components:
┌─────────────┐  fires   ┌────────────────┐  runs   ┌─────────┐
│ Alert rule  │ ───────▶ │ Alert event    │ ──────▶ │ Action  │
└─────────────┘          └────────────────┘         └─────────┘
   Condition              History entry             Send email
| Component | Role | Where to find it |
|---|---|---|
| Alert rule | Defines the metric threshold and evaluation | Monitoring > Alert > Alert Rules tab |
| Action | Defines who is notified and how when the rule fires | Monitoring > Alert > Actions tab |
| Alert event | The history of when the rule fired | Alert rule detail > Alert Events tab |
Alert.AlertRule.CREATE,Alert.AlertActionTemplate.CREATEpermissions. Among the built-in roles, Reader can only view alerts.- Create the action first, before creating an alert rule
Evaluation state and rule state
An alert rule has two kinds of state.
| Evaluation state | Meaning |
|---|---|
| Ok | The metric is within the threshold |
| Alert | Threshold exceeded; an alert has fired |
| No Data | Not enough data to evaluate |
| Rule state | Meaning |
|---|---|
| Activated | Periodically evaluated; fires when conditions are met |
| Paused | Evaluation is suspended; no alerts will fire (settings are kept) |
Step 1: Create an action
First, create the action (currently email) that fires when an alert triggers.
-
In Monitoring > Alert, open the Actions tab and click Create Action.
-
Fill in:
Field Description Action Name Identifier (e.g. GPU failure alert)Action Type Email(webhooks coming soon)Recipient Emails Add users via search, or enter comma-separated addresses (at least one) -
Click Create.
Integrations with Slack webhooks and other external services are planned.
Step 2: Create an alert rule
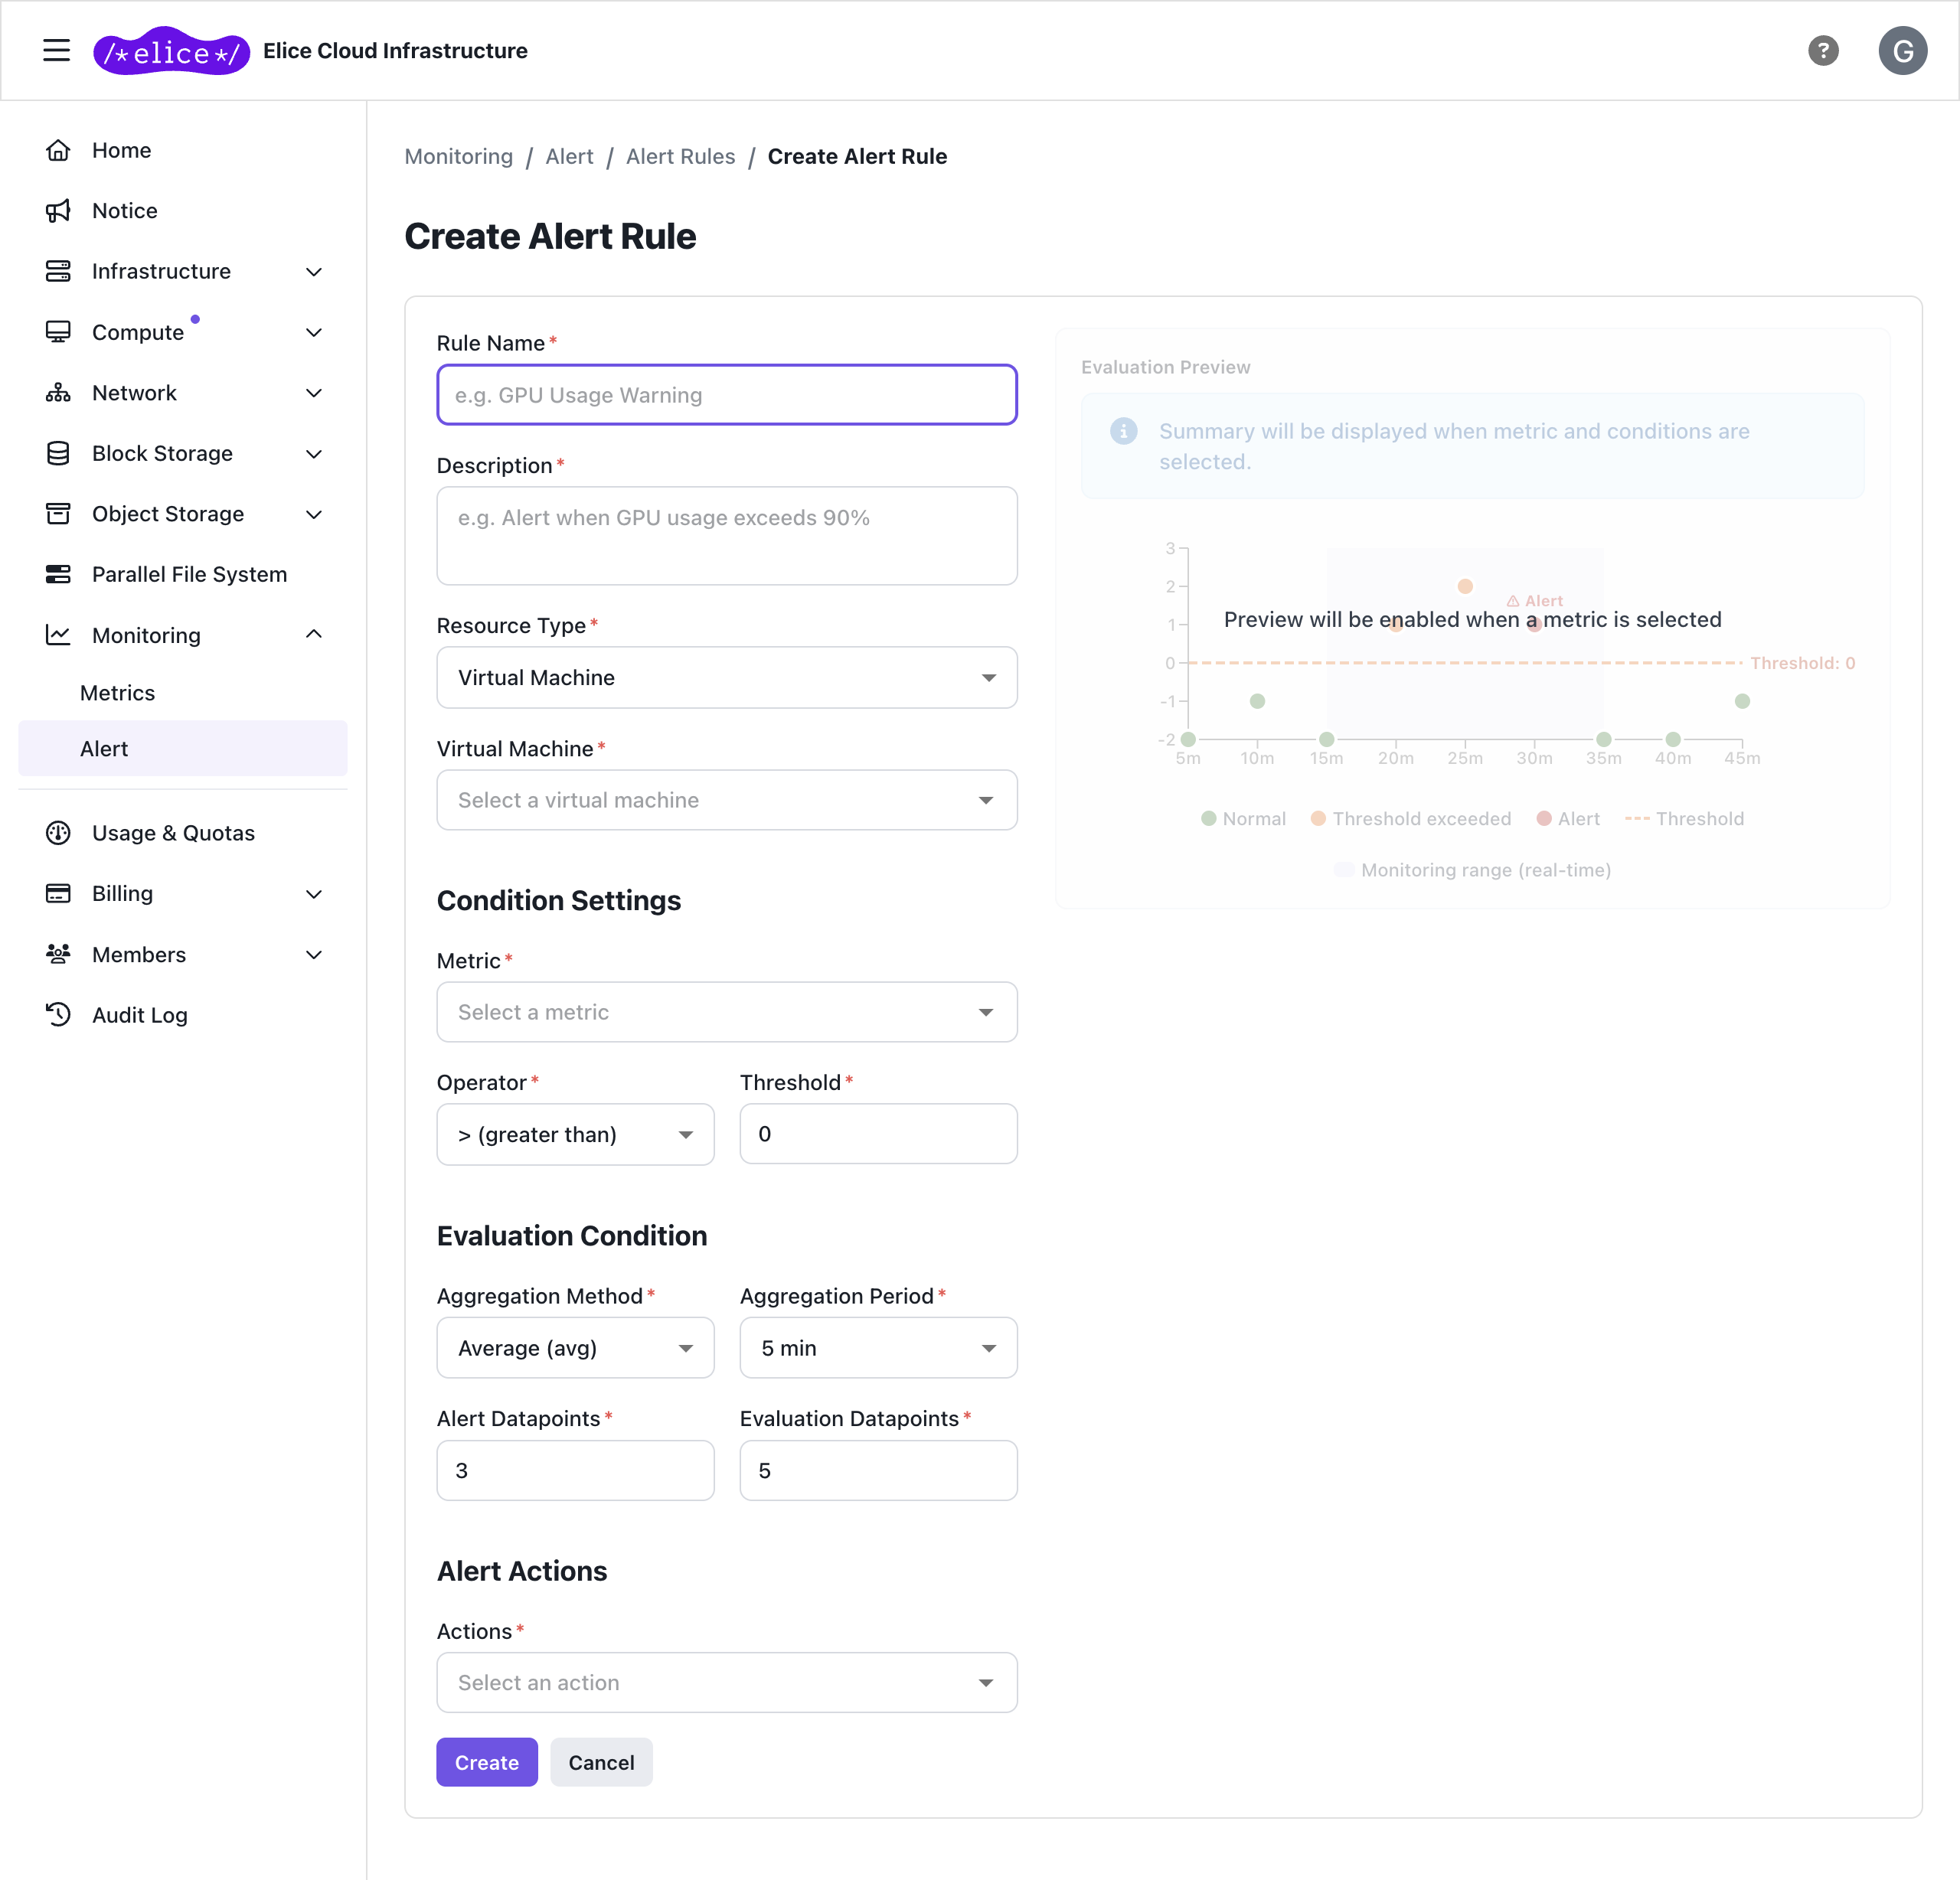
- On the Alert Rules tab of Monitoring > Alert, click Create Alert Rule.
- Fill in the following:
Basic info
| Field | Example |
|---|---|
| Name | GPU utilization warning |
| Description | Alert when GPU utilization exceeds 90% |
Target resource
| Field | Description |
|---|---|
| Resource Type | Virtual Machine or Object Storage |
| Resource | The VM or bucket to monitor |
| Metric | Depends on the resource type (see below) |
VM metrics
| Category | Metric |
|---|---|
| GPU | Utilization (%), memory used/total (MiB), temperature (°C), power (W), clock speed (MHz) |
| CPU | User · System · Idle · I/O Wait · IRQ · Soft IRQ · Steal · Guest · Nice (%) |
| Memory | Total · Available · Active · Inactive · Cached · Buffers · Free (KiB) · Swap |
| Network | RX/TX bandwidth (Bps) · bytes · packets · drops · errors |
| Storage | Usage (Bytes) · read/write throughput (Bps) · IOPS · latency (sec) |
Object storage metrics
| Metric | Description |
|---|---|
| Usage | Bucket size in bytes |
| Object count | Number of objects in the bucket |
| GET / PUT / COPY / LIST | API request counts |
| Multipart uploads | Number of multipart upload operations |
Evaluation conditions
| Field | Description |
|---|---|
| Aggregation Method | avg / sum / min / max (AlertAggEnum) |
| Aggregation Period | 1m / 5m / 15m / 30m / 1h |
| Operator | > (greater than) / >= (greater than or equal) / < (less than) / <= (less than or equal) |
| Threshold | The value that triggers the alert (e.g. 5, 90, 0.85) |
| Evaluation Datapoints | How many recent datapoints to inspect (e.g. 5): datapoints_to_evaluate |
| Alert Datapoints | How many of those must breach to fire (e.g. 3): datapoints_to_alert |
Example: interval 5m, evaluate 5, alert 3 → measure every 5 minutes over the last 25 minutes; if 3 or more breach the threshold, fire an alert.
The system aggregates data over each interval into one value before evaluating. An in-progress interval has incomplete data and is excluded from evaluation.
For example, with a 5-minute interval and a 80% GPU utilization threshold, suppose the 10:15–10:20 interval just started and GPU briefly spiked to 95%. The breach is not counted until the 5-minute window closes and the actual average is computed. If that average turns out to be 72%, the interval is classified as Ok.
Preview diagram
The Evaluation Preview diagram in the form shows how your conditions will be evaluated and updates live as you change them.
- Green dots: datapoints within the threshold
- Yellow dots: datapoints that breached the threshold
- Red dots: points where the alert actually fired (datapoints-to-alert reached)
- Dashed line: the threshold
Link the action
Pick the action you just created (you can select more than one).
- Click Create.
Use-case walkthroughs
GPU overload alert
- In Monitoring > Alert > Actions, create an email action with recipients.
- On the Alert Rules tab, click Create Alert Rule.
- Pick the VM to monitor as the target resource.
- Set the metric to GPU Utilization, operator
>, threshold90. - Set the evaluation: interval 5 minutes, evaluate 5, alert 3.
- Check the Evaluation Preview diagram to confirm the rule behaves as intended.
- Select the email action and click Create.
Object storage capacity alert
- If you don't have one already, create an email action first.
- In Create Alert Rule, set the resource type to Object Storage.
- Pick the bucket to monitor.
- Set the metric to Usage, operator
>=, threshold to your target capacity (Bytes). - Set evaluation and action, then click Create.
Investigating an alert
- On the Alert Rules tab of Monitoring > Alert, click a rule whose State is Alert.
- On the Alert Events tab, check recent state transitions and when they occurred.
- On the Metric Chart tab, set the time range to match the time of occurrence to see the metric at that moment.
- Once you've identified the cause, take the appropriate action.
Common alert rules
| Goal | Metric | Agg / interval | Operator | Threshold | Evaluate / Alert |
|---|---|---|---|---|---|
| Detect training completion | GPU utilization | avg / 5m | < | 5 | 2 / 2 |
| GPU OOM risk | GPU memory usage | max / 1m | > | 90 | 3 / 3 |
| Detect VM abnormal shutdown | CPU utilization | avg / 5m | < | 1 | 1 / 1 |
| Disk-full risk | Disk utilization | max / 5m | > | 85 | 1 / 1 |
| Idle GPU (cost leak) | GPU utilization | avg / 1h | < | 30 | 1 / 1 |
Checking alert events
When an alert rule's evaluation state changes, a history entry is recorded automatically. There is no separate page that lists events on their own; check each rule's history on the Alert Events tab of the alert rule detail page.
| Column | Description |
|---|---|
| State Transition | Ok → Alert / Alert → Ok, etc. |
| Occurred At | When the state changed |
Managing alert rules
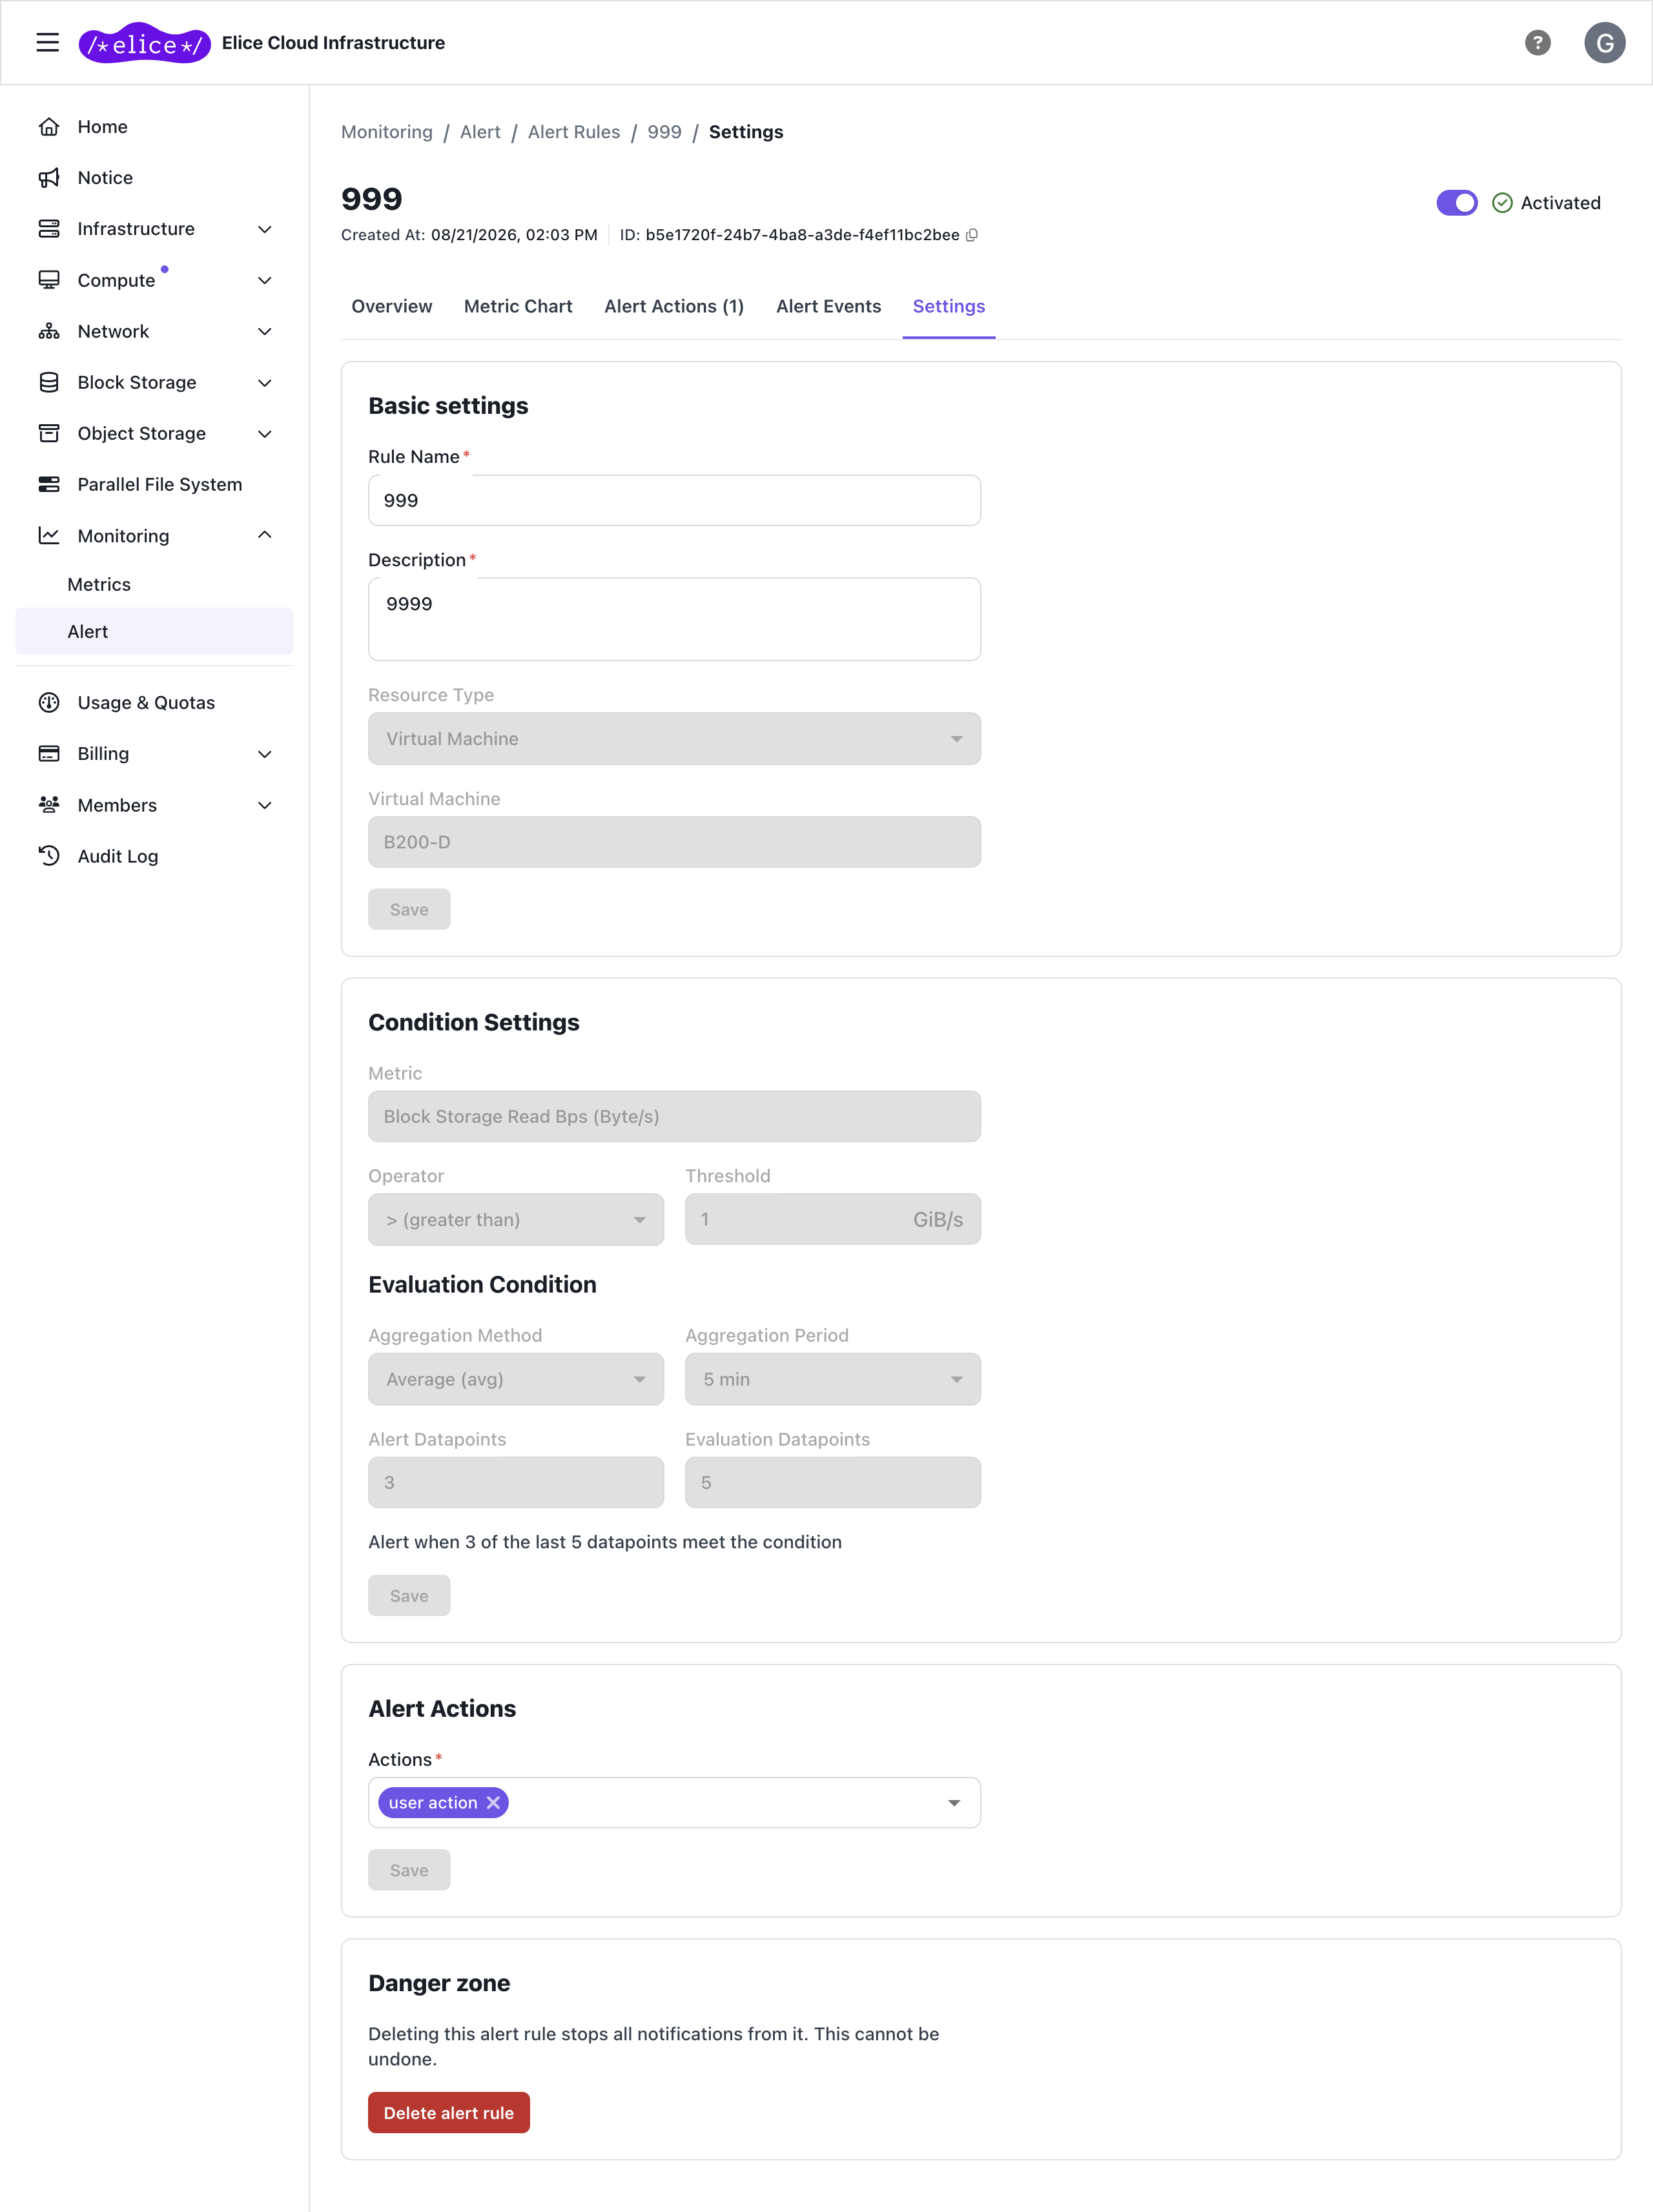
The rule list is read-only; its Active column shows whether each rule is activated. Make changes on the detail page that opens when you click a rule.
- Activate / Pause: use the switch at the top of the detail page (the rule itself is kept). Requires the
Alert.AlertRule.UPDATEpermission. - Edit: change thresholds, conditions, or actions on the Settings tab and Save.
- Delete: delete the rule at the bottom of the Settings tab. A deleted rule cannot be restored.
A paused rule isn't evaluated and produces no alert events. Pausing rules tied to VMs that are under maintenance is a good way to avoid false alerts.
Rule detail page tabs
Click a rule in the list to open the detail page, which has five tabs:
| Tab | Contents |
|---|---|
| Overview | Current state, last update time, a natural-language summary of the condition, target resource (click to jump to the resource page) |
| Metric Chart | Chart of the monitored metric with the threshold. Time range: Last 30 minutes through Last 30 days, or Custom |
| Alert Actions | Alert actions linked to this rule. Click to jump to the action's detail page |
| Alert Events | State-transition history (Ok → Alert, Alert → Ok) and when each occurred |
| Settings | Edit and delete the rule |
The action detail page has Overview, Used by rules, and Settings tabs; edit recipient emails and delete the action on the Settings tab.
FAQ
Evaluation state shows "No Data"
- Confirm the target VM is in the Running state
- Confirm the rule is Activated (paused rules are not evaluated)
- Right after creating a rule, No Data can appear briefly until enough data is collected
I'm not receiving alert emails
- Confirm the rule has an action attached
- Confirm the action's recipient email is correct
- Check your spam / junk folder
What's the difference between "datapoints to evaluate" and "datapoints to alert"?
- Evaluation Datapoints: how many recent datapoints to look at (the window size)
- Alert Datapoints: how many of those must breach the threshold to fire (the trigger condition)
- Setting them equal means every point must breach (strict). Setting "alert" to 1 means a single breach is enough (sensitive)
Can I delete an action?
Deleting an action that other rules are using means those rules no longer send notifications. Check the Used by rules tab on the action detail page first, then delete the action at the bottom of the Settings tab.
Next steps
- Metrics Explorer: inspect metric trends before picking a threshold
- Audit log: track changes to alert rules